
GelApp is a free mobile application that automatically detects and quantifies gel electrophoresis bands for “on-the-go” gel documentation. It facilitates quantitative biological research by providing more accurate band sizes. Through the novel implementation of Gabor filters, faint bands can be better detected from noisy backgrounds than conventional image analysis methods. Plotting the marker standard as a logarithmic (log) graph, the sample band sizes are calculated more accurately. Combined, these features help increase the productivity and accuracy of gel electrophoresis analysis that every scientist can carry in their pockets.
Quantitative analysis of nucleic acid and protein bands for gel electrophoresis plays an important role in biomedical experimental research. For example, the insertion of 33 base pairs (bp)1 and 93 bp 2 to the Fibrillin-1 gene (FBN1) causes Marfan syndrome. Similarly, the deletion of 24 bp 3,4 and 366 bp 5 in the same gene leads to the Weill-Marchesani syndrome. Since both insertions and deletions in genes can lead to band size changes, nucleic acid and protein gel electrophoresis (polyacrylamide gel or PAGE) are useful methods of preliminary screening. However electrophoresis results are typically estimated, resulting in overlooking such small differences.
Many gel quantification software are freely available for accurate band size quantification. However these software may face challenges in detecting faint bands in the utilization of peak and density analysis (usually along with image threshold). Gel Documentation (Gel Doc) equipment such as the BioDoc-It® Imaging System from UVP http://www.uvp.com/biodocit.html provides better detection and quantification of band sizes (including faint bands), but are bulky and expensive.
Highlighted in a recent Biospectrum article, biomedical research mobile apps may make an impact on biological research http://www.biospectrumasia.com/biospectrum/opinion/220592/use-smartphone-apps-biomedical-researchsuch as DNAApp 6 and YASARA View7. However, no automated band size calculation apps have yet to fully materialise on mobile phones.
Therefore, to address the need for portability and improve on current image processing methods, we developed GelApp – a mobile app that automatically detects bands on noisy gel images and plots a logarithmic (log) graph from the marker standards 8,9. Tapping on advanced image analysis methodologies such as Gabor filter, it improves the detection of faint bands and facilitates reproducible experimental research.
GelApp for Android was developed using version 4.4 of the Eclipse Integrated Development Environment, Luna https://eclipse.org/ utilizing open source libraries: Mike Ortiz’s TouchImageView https://github.com/MikeOrtiz/TouchImageView for the editing, zooming, and panning functions on gel images; aChartEngine http://www.achartengine.org/ for the generation of logarithmic graphs; and Itseez’s OpenCV http://opencv.org/ for the Gabor filter, threshold and Gaussian blur.
GelApp for iOS was developed using XCode 6, Itseez's Open CV, and Kishikawa Katsumi's PEPhotoCropEditor https://github.com/kishikawakatsumi/PEPhotoCropEditor.
Gel image pre-processing
Images loaded on GelApp can be adjusted to overcome environmental factors (e.g. lighting, angles) to improve band detection. The images can be brightened or darkened to remove and intensify objects. Cropping can also be performed to isolate desired regions reducing interferences with the detection process. Gaussian blur can also be applied to reduce unspecific blobs on the image.
Segmentation and detection
Gabor filter was implemented for gel image segmentation and to isolate the horizontal orientation of gel fragments (Figure 1). The Gabor Filter is obtained by modulating a sinusoid with a Gaussian function as shown:
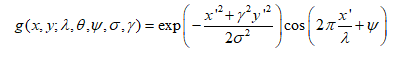
GelApp requires users to adjust only the Sigma (σ) and Lambda (λ) properties of the Gabor Filter, with a range from 0 to 100. σ controls the standard deviation of the Gaussian to specify the diameter of the effective region within the Gabor Kernel, and λ controls the wavelength of the sinusoid to define the thickness of detected edges.
Once the parameters are optimized, a minimum pixel number (based on the smallest band size) is set by the user for automated detection of desired bands. Colour intensities were detected and scanned for the boundary boxes to be drawn with respect to the centre of detected bands.
Since automated detections are limited and affected by image quality and filter settings, users can remove or add bands by the editing interface once the automatic detection is completed.
Band size calculation
For calculation of band distances, an “estimated distance from the well” (edw) using the top of the gel images to the centre of the respective marker bands were used.
Marker matching begins from the top-most band since small bands may run out of the gels during the experiments. The remaining marker data points are plotted with a line of best fit (standard curve, see Figure 1C and D). For greater accuracy, the graph would remove the smallest band and re-plot should the bands deviate from the line by more than 30 pixels. This process would repeat until there are minimal outliers.
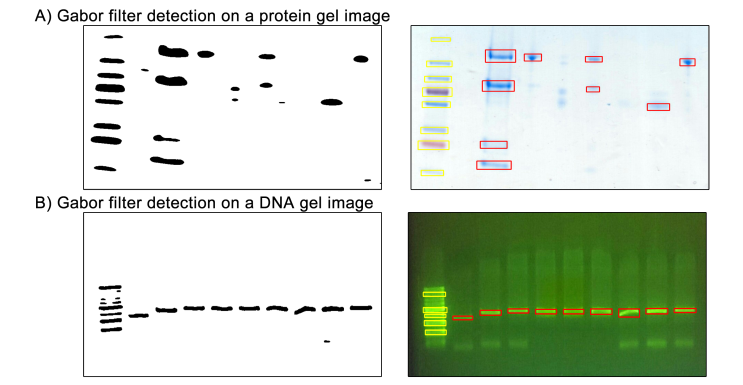
Figure 1. GelApp’s Gabor filtering and detection for (A) protein and (B) DNA gel images.
The plot function takes the log10 of the marker band molecular weight (in bp or kDa) as the Y-axis and the distance of the bands from "edw" (in pixels) as the X-axis. The line of best fit generates a line equation from which the sample band molecular weights are calculated. The calculated values would be displayed next to the band on the final gel image.
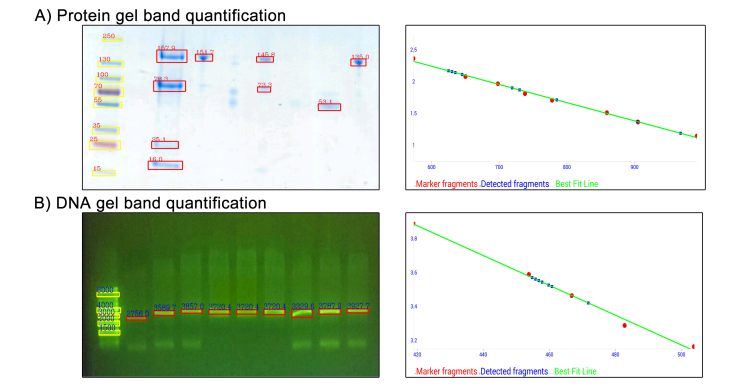
Figure 2. GelApp’s quantification features for (A) protein and (B) DNA gel images.
While the smartphone is unable to emit UV or blue light necessary for common DNA dyes, real-time electrophoresis machines with in-built blue lights (e.g. Cleaver Scientific’s RunVIEW and Major Science’s SafeBlue Electrophoresis System) easily overcome this limitation. Utilizing the in-built phone camera, pictures can be taken without additional peripheral devices.
All image processing software are affected by the quality of the images that is in turn, affected by many factors such as photography skills, lighting, actual experimental process. Nonetheless, with improved automated band detections and log graph calculations, GelApp allows the calculation of bands from internal markers in the same gel, increasing size accuracy, and reducing inter-experimental errors.
GelApp does away with human estimations (influenced by experiences and many inter-observer factors), thus increasing the reproducibility and forges the widely used electrophoresis methods towards more quantitative biology research. Packed into a smartphone, such analysis are now also “on-the-go”.
With the snapshot feature and “export image” feature, GelApp can be used for reporting band sizes objectively. In March 2015, an original article10 was published utilizing results generated from GelApp, demonstrating the potential use of this app for high quality scientific reports and papers.
Availability and implementation
GelApp for Android and iOS are available on the Google Play Store and Apple App Store free as ‘GelApp’. More details on the app can be found at www.facebook.com/APDLab; www.bii.a-star.edu.sg/research/trd/apd.php
The GelApp user guide is available at http://tinyurl.com/GelApp, and a video tutorial is also available on the Google Play Store.
Contact: samuelg@bii.a-star.edu.sg; bii-apdlab@bii.a-star.edu.sg
Funding: This work is funded by the Joint Council Office, Agency for Science, Technology, and Research, Singapore
[1] Hutchinson, S., Wordsworth, B. P. & Handford, P. A. Marfan syndrome caused by a mutation in FBN1 that gives rise to cryptic splicing and a 33 nucleotide insertion in the coding sequence. Hum. Genet. 109, 416–420 (2001).
[2] Guo, D. et al. An FBN1 pseudoexon mutation in a patient with Marfan syndrome: confirmation of cryptic mutations leading to disease. J. Hum. Genet. 53, 1007–1011 (2008).
[3] Hollister, D. W., Godfrey, M., Sakai, L. Y. & Pyeritz, R. E. Immunohistologic abnormalities of the microfibrillar-fiber system in the Marfan syndrome. New Engl. J. Med. 323, 152–159 (1990).
[4] Collod, G., Béroud, C., Soussi, T., Junien, C. & Boileau, C. Software and database for the analysis of mutations in the human FBN1 gene. Nucleic acids Res. 24, 137–140 (1996).
[5] Faivre, L. et al. In frame fibrillin-1 gene deletion in autosomal dominant Weill-Marchesani syndrome. J. Med. Genet. 40, 34–36 (2003).
[6] Nguyen, P.-V., Verma, C. S. & Gan, S. K.-E. DNAApp: a mobile application for sequencing data analysis. Bioinformatics (2014). at
[7] Krieger, E. & Vriend, G. YASARA View - molecular graphics for all devices - from smartphones to workstations. Bioinformatics 30, 2981–2982 (2014).
[8] Peacock, A. C. & Dingman, C. W. Molecular weight estimation and separation of ribonucleic acid by electrophoresis in agarose-acrylamide composite gels. Biochemistry 7, 668–674 (1968).
[9] Rochelle, P. A., Fry, J. C., Day, M. J. & Bale, M. J. An accurate method for estimating sizes of small and large plasmids and DNA fragments by gel electrophoresis. J. Gen. Microbiol. 132, 53–59 (1986).
[10] Ling, W.-L., Lua, W.-H. & Gan, S. K.-E. Fast reversible single-step method for enhanced band contrast of polyacrylamide gels for automated detection. Electrophoresis (2015). at
APD SKEG Pte Ltd is the member of

Scientific Phone Apps and Mobile Devices is in the Research collection of

Scientific Phone Apps and Mobile Devices is affiliated with