
In this paper, we present an alternate use of smartphone technology for RF detection and analysis. With minimal modification to the original Smartphone hardware, i.e. Wifi, Bluetooth and XBee add-on, as well as using firmware algorithmic modifications to the smartphone (using Linux Plasma Mobile Distro), the aim is to have the most precise objects detection and positioning system.
Many research fields use Radio Frequency (RF) readings for data measurement and visual data extraction. In some of these research fields associated with spatial analysis, we can use RF technology to obtain relevant information on our surroundings.
In our previous research [1], we demonstrated that it is possible to modify smartphones and add newly designed components that allow us to map metallic elements in an enclosed room. On this we desire to solve a similar problem using different paradigms and minimize the hardware requirements by using only a closed box smartphone to measure and detect metallic objects in enclosed areas.
To do so, our research focused on three goals: 1) pinpointing existing frequency emitters, 2) metal detection through fixed and precise frequency filtering 3) distance access to the detection data for remote control of the Fog Network [2].
The research in this paper will demonstrate that it is possible to take advantage of the existing sensors in a smartphone device (specifically an Android device) and translate the gathered information for useful analysis and mapping of the surrounding area [3].
As part of the research we had to study similarities and differences in existing technologies, investigating technological solutions that were published only recently [4]. All with the aim to detect metallic objects just by using our mobile phone, and that by correctly combining the information in a fast computation database, it may allow us to calibrate the system and improve its precision.
As part of the research, we attempted to work with three frequency candidates (2.4GHz Wireless, 2.4GHz XBee and GSM) [5]. By using the appropriate smartphone device (Nexus 5X) it was possible to experiment on all the technological solutions that smartphones can offer today.
For the remote communication system, we incorporated the popular Firebase system, based in a MongoDB no-sql database structure and the use of lambda functions for remote update and access.
Finally, our proposed solution will also consist of a distributed app for Android mobile phones called RRadarApp (Remote Radar App).
In this section, we will introduce the available tools that allowed us to calculate the experimental results, as well as the methods that were used for such goals and the required prerequisites.
Prerequisites - Device
Our motivation was to achieve a similar result as of our previous work [1], but by changing the working tools. Our first goal was to detect metallic devices in an enclosed space. This could be either achieved by introducing into the scanning area a device that emits radio-frequencies also considered as an emitter, and by gathering the information from outside the room, or by trying to send and receive RF from outside the room and attempting to filter the data.
Previously, we suggested a non-intrusive solution. In this research, we propose to introduce the smartphone in the room to obtain relevant information from the room itself, and map potential positions of metallic objects, which by itself is an intrusive solution.
From an exhaustive process of comparison between smartphones, it was concluded that the best choice to attempt this experiment was the use of the LG Nexus 5X, because of its hardware specifications and ease of manipulating its hardware interface layer (Halium).
What made the device more appropriate for our purpose is its large spectral range combined with the necessary algorithmic solution (this allowed us to use not only the RF emitting from the device itself, but also from different devices operating in the spectrum), its high reliability (the device can be upgraded to the latest Android OS version 8.0), its CPU chipset version (allowing us to generate our own OS based on the original AOSP or Android Operation System Platform) and the device is equipped with Wi-Fi 802.11 operating in a/b/g/n/ac protocols (a large portion of the Wi-Fi spectrum). The device is also equipped with Type-C USB connector, which when combined with the appropriate adapter, will allow us to connect a XBee Pro USB adapter device and communicate with the XBee Pro chip device for further experiments.
Prerequisites - Software
In addition to the hardware specifications, the Nexus 5X smartphone is also the most adaptable device available this moment in the market from a software point of view.
The Hardware Interface Layer of the Nexus 5X is easily adaptable, and its hardware is so generic that it allows the developers to modify the original OS and easily recompile new version of the OS for firmware manipulation.
For remote data gathering and analysis it was decided to incorporate the Firebase cloud system. This offers a complete hosting solution as well as a possibility to contact the database using simple http requests, something that will come in handy when receiving the data from the device. The most attractive characteristic of Firebase cloud service is the fact that it can inform the smartphones and other listening clients on changes in the database, as well as many other functional changes in the hosting system, a fact that will considerably improve the functionality of our Fog Network system.
From all this we extracted several tools necessary for the collection of relevant data to provide a successful simulated solution [6].
Prerequisites - Tools
The first tool available for our research was an Android ASUS Z00MD device, running an Android 6.0.1 version, with the basic Wi-Fi and GSM communication bands. The tools changed as we progressed with our research. The development took place mainly on an Ubuntu 16 operating system, with the installed ADB and Android frameworks for correct software deployment.
After the first attempts to create specific Android apps for firmware manipulation and its subsequent failure, we created a customized AOSP (Android Open Source Project) for the device. This was done via Android Open Source Project as well as the Cyanogen and Lineage OS systems.
Another tool we used was the XBee Pro Chipset device, used to complete our research process as a comparative alternative to the internal Nexus 5X sensors [7].
As a requisite for frequency-based computation, a deep knowledge in frequency computation mathematics is required. Combining the data received from the sensors through the firmware, the ability to modify the working software of the device was required to take all the acquired information in time to delineate and interpret the information, creating the appropriate data and graphic representation [8].
This created a heat based graphic rendering of the scanned room, showing the spots in which, a higher concentration of radio-frequency signal strength was detected. We filtered out other frequency emitters and frequency repeaters. While the emitters may include other phone devices as well as routers and Xbee routers, it was the repeaters (objects that bounce the signal) that are recognized as potential metallic objects.
Movement calculation and mapping
To draw a 2D map in time, we calculated and triangulated the smartphone position in the inspected space. Should the smartphone be used by a person and that person moves in the room, we will use that movement to cross-reference previous information and try to improve the resolution of the map [9].
The Nexus 5X accelerometer and gyroscope, combined with the triangulation using the surrounding frequency emitters in the room, provided an approximate positioning of the metallic objects in the area. Since there was no predetermined knowledge of the place in which the frequency emitters may be, i.e. other smartphones or access points, we initially filtered the potential objects into two categories: the repeaters which would be those objects that bounced the signal, and the emitters that generated the signals.
In all regards, the process would always define frequency energy sources as repeaters until it is proven otherwise. This is because there is a high probability of having a very low-level frequency strength which after a certain movement by the subject, could be an emitter. For consistency, all low-level emitters that fall into the category of repeaters will be considered as such.
For triangulation purposes, we will follow the method previously described [9] [10]. The RSSI (Received Signal Strength Indicator) refers to the received signal strength, L represents the overall signal strength and it can be calculated from the inverse relation between the path loss and the distance’s square:
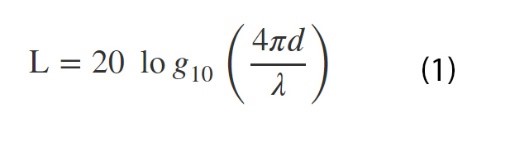
Where d is the distance and λ is the path loss. Using the Pythagorean theorem on the intensities and the position on a 2-D model, we can get a partial triangulation:
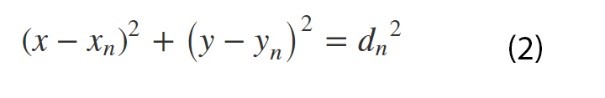
X and Xn represent a position on a 2-D Cartesian plane as well as Y and Yn. dn being the resulting distances. Combining this equation with the intensity origin in a matrix, it allows us to calculate the intensity level in a certain distanced position from the energy emitters.
Radio Frequency Interpretation
We will use the same method for RF intensity calculation and triangulation [1]. To identify variations in the frequency behavior at every move of the smartphone.
This use of the smartphone device here is like a spectrum analyzer, with the difference that it is only limited to a certain number of frequency channels. By accepting all the available frequencies ranges, in Wi-Fi, XBee, and GSM, we were able to proceed and obtain the heat value of the frequency in each position of the device [11].
To adequately use these results, it was necessary to follow certain mathematical procedures combined with software development and implement it in the smartphone device. It will also require the adaptation of the technological environment and its limitations. The specific requirements are as follows:
• The use of the Wi-Fi antenna technology covers the spectrum from 2412MHz to 2477MHz and the spectrum from 5170MHz to 5805MHz. The Nexus 5X Wireless antenna compiles both potential spectrums, and this motivated us to consider both ranges in the object detection process.
• The GSM/CDMA/HSPA/LTE ranges, varying from 700MHz to 2500MHz. was incorporated into the software algorithm for development [11].
• The last tech antenna to be used is the XBee protocol. Like the Wi-Fi 802.11, the XBee Pro protocol works on ranges from 2400MHz to 2483.5MHz. In this case we took in consideration all possible interferences with the wireless antennas.
• From an algorithmic point of view, the process for each antenna as well as combining the three were the same.
We used two types of scanning modes; the first is a passive scanning mode, in which the device only receives information trying to interpret the frequency in the region like a spectrum analyzer. Once the information was gathered, it would constantly attempt to pinpoint possible metallic candidates, and potential frequency sources. Increasing the data gathering samples will increase the map resolution, allowing the phone to improve computation and turning metallic passive devices to energy source devices.
The second mode of operation functions as a radar. In case the amount of frequency signals in the scanning region is low or practically undetectable, the device itself will try to generate a frequency field and act as a radar. This process required further modification to the basic firmware as well as the incorporation of the XBee Pro chip in the scanning process.
Simultaneous calculations
Improving from our previous research [1], we implemented the use of simultaneous sensors and data computation for resolution improvement. While each of the individual three sensors mentioned above were able to map the present metallic devices with the help of the correct algorithmic logic, by combining all the sensors we may use the full extent of the device capabilities.
This concept presents us with new challenges, mainly in interference and noise interpretation. Combining the Radio Interface Layer (RIL) with the Wi-Fi layer may be an interesting option. Combining the XBee with the Wi-Fi may be more challenging. It was interesting to try an Tx and Rx separation between Xbee and Wi-Fi, something that was attempted as part of the experiment [13]. It gave us a certain amount of information in scanning the room area. The later solution will show us the potential of turning the device into a Frequency Continuous Modulated Wave radar, like in our previous study [1]. Yet it should be remembered that the spectrum on which both the WiFi and the XBee devices operate coincide but do not match.
In this section we will describe the experimental process of our research.
Choice of Smartphone and testing
The crucial requisite for our research was that all the hardware elements be inside the smartphone device. The first was to choose between the two systems available in the market: iOS-based device or Android based device.
While iOS devices showed a higher hardware potential and benchmark result, it was also a restricted system, more so than the Android OS devices. Those, we chose an Android device as they are open source [14].
Once the Android system was chosen as our main target, selecting the device itself became a complicated task. Initially, a HTC Desire device was used for our first experiments, but while software development on a native level was possible, attempts to modify OS level software and even firmware logic became troublesome. Hardware Interface Layer packages for manipulation of this device were not publicly available and attempts to reverse-engineer were counterproductive. From the attempts to create an OS build on the device (being an old version of the HTC Desire family), it became impossible to execute the compilation and building methods for AOSP or Lineage OS systems targeting this device [15].
Eventually, the device was discarded from the study, next we attempted the ASUS Z00MD device, but while it was possible to create a native basic software to communicate with the XBee chipset through the USB port, nothing else differed from the HTC. Even after modifying permission access level to the OS, the device did not comply with our development needs. Many of the problems encountered in the HTC were also found in the ASUS device. While a custom OS (Lineage OS) was successfully installed, it did not allow for the customization of our solution. Without modifying the HIL, it was impossible to intercept the frequency modulation and obtain relevant data [16].
After further search for the most generic, common, and reliable hardware distribution within Android devices, we came up with the Nexus 5X. Its hardware was by LG and Google. Both companies ensured the device was as flexible as possible for development and experiments. The Nexus 5X was found to be a perfect candidate, as it also had the option to rebuild and customize a variety of operating systems.
Software solution
The decision to choose the Nexus 5X was not only from a hardware perspective as described before, but also from extensive software and benchmark testing.
Our main difficulty with the other devices was the modification of portions of private algorithms closed to the public and of proprietary nature. Our research process was limited in time and resources, and we could not count on receiving complete support and access to all proprietary hardware firmware. Thus, these considerations led us to bypass both the HTC and the ASUS devices.
While it was possible to build our own Android Operating System with some level of software modification, the proprietary packages and libraries, mainly in the RIL and in the WiFi sensors were a significant inconvenience. All AOSP solutions required the incorporation of third-party firmware packages precisely in the hardware available and thus we sought for an alternative Android based OS platform smartphone.
Lineage OS was our first choice. Based on the Cyanogen OS, the Lineage OS was a platform for developers who wanted to customize and build their own Android operating system.
Built on the Android OS, it allowed a larger access to the basic libraries, and modification of proprietary firmware. Still, applying this new OS builds to the HTC and the ASUS Smartphones became impossible due to compatibility reasons.
After extensive search for the best candidate for development the Nexus 5X device was chosen. Again, this device allowed us to create a customized OS, based on Lineage OS, and could be successfully manipulated at most of the software layer. Yet, after testing several benchmark software, and being in an advanced stage of our software development, a serious problem was encountered. We discovered that the Lineage OS did not allow us to completely modify the HIL, and that even though we were able to change parts of the firmware and the drivers as well as the software connector packages in the OS before building, the access granted us by this solution was limited, mainly in the RIL level.
This time we tried to directly install a Linux based OS on a device without any kind of intermediate proprietary software, thus we tried the Plasma Operating System for Nexus 5X devices. Plasma is a Linux OS, based on KDE that runs upon Halium as the Hardware Abstraction Layer [17]. By using a Linux distro, which used the open source solution for the hardware in question as seen in Figure 1, and covering both the RIL as well as the wireless antenna, it allowed us to proceed with the development of our software solution.
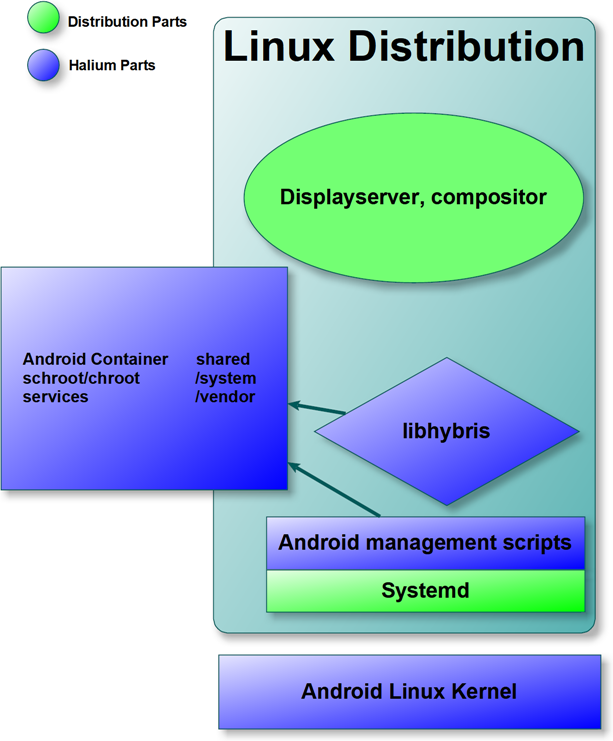
Figure 1. Project Halium distribution of the Android Smartphone Device.
Ofone
The Plasma Mobile OS allowed us to work freely on the hardware sensors in the Nexus 5X device. One of the most important packages that we worked with was the Ofone library. Ofone is the library in charge of accessing all the functionalities of the RIL, allowing us to have a better access to the received data in the Radio antenna.
The software developed to use this library was made to switch between potential frequency ranges and pinpoint the candidate objects, sending the information to a FireBase database. This allowed us to have access from a third-side client.
All the developments in this paper regarding RIL access, were done using the Ofono library.
WiFi antenna
By installing the Plasma Mobile OS to the device and using the Wireless firmware that comes by default with this version of the OS, software development on the different wireless sensors was like the development of any other driver solution for a hardware device. Considering this specific case, wireless chips in Smartphones had the option to turn into a wireless provider for other devices. This process is called Thatering and it allows devices to simulate the behavior of an access point. By using this functionality and trying to modify the Plasma Mobile OS system to interpret the frequency information from our scanning, we were able to obtain information with higher precision from other 802.11 devices in the area.
XBee chipset
The XBee Pro chipset solution under the Linux distro exhibited a similar behavior as in other smartphone devices. Considering that the XBee Pro chip was an external device and that it was connected through the USB port, it only required mounting and communication via a byte sequence structure, as can be seen in Figure 2.
When attempting to combine it with the wireless antenna, we had to program the software to simulate a FCMW radar system operating only in the frequency domain shared by the WiFi and XBee protocols (between 2.4GHz and 2.48GHz) [18].
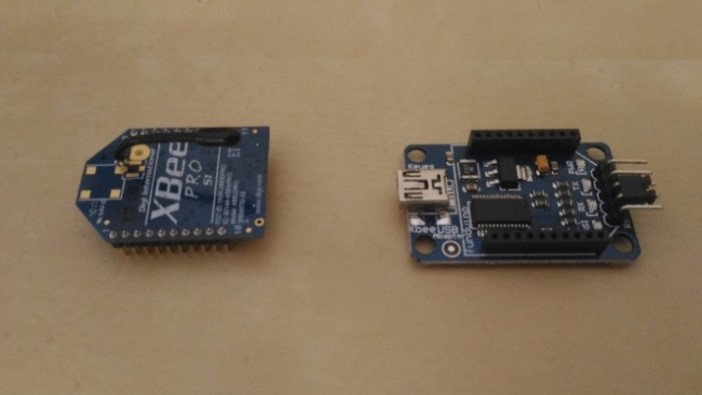
Figure 2. XBee Pro S1 chipset and adapter.
Software development
Once we compiled all the requirements for the experiment, defining the OS, chose and defined the capabilities of the right hardware and firmware, we proceeded with the software development.
All dependencies for development belong to the Linux distribution, which in turn is part of the Debian family branch. Incorporation of all libraries and packages to the Plasma Mobile OS for the Nexus 5X was done by a simulated SSH connection over the USB mounted port.
The behavior of the system itself using the SSH method was typical of any other SSH connection except for the USB port which reduced latency issues and increased the development speed.
Next, we proceeded to create a C++ based App for Linux. As previously mentioned, the program is dependent on the system libraries like Ofono, Wireless, and USB port connection libs.
Regarding the first library, we pulled the corresponding open source code from repository and recompiled it to work in our Plasma Mobile OS environment. The Ofono library allowed us to directly experiment on the RF antenna of the phone.
Wireless and USB communication libraries are officially part of the Linux distro and only the base package was required to interact with these libraries. Nonetheless, we had access to the base Wireless and XBee code libraries to decipher and document the frequency access and interpretations.
The scanned information would be a result of processing radio frequency data (mainly dBm information regarding signal strength of the filtered frequency) and its combination with previously gathered information using a large collection of samples, building up the area-based calculation by passing it through a C++ representation of the mathematical formulas described above.
Accessing the other sensors for a better mapping experience was somewhat complicated. While the location-based firmware was accessible, the rest of dependencies on gyroscope and accelerometer were hard to access. Raw information was possible to be extracted but it was through the location layer, and it was as precise as the Android based alternative. It is important to mention that the Plasma Mobile OS was only in its Alpha version, and that many system firmware libraries were still in a very early stage of development.
Scanning and mapping
From the moment the app started its execution, it gathered and saved relevant data on the phone as well as sent it to the remote database system. To successfully create a heat map of the area, it was necessary to present a 2D map. For that we devised a 2D representation of intensity using a simple matrix and increased the resolution as much as the max strength and frequency signal would allow [19].
Improvements to the signal resolution could be perceived during a period, and it would have to be contemplated in our calculations. This required a global modification of values when we detected jumps in frequency signal strength. It would be associated with the position triangulation of the objects using the signal source, also using a collection of previous data for resolution improvement.
The process scanned all possible spectral ranges, and for each range, it would create an independent 2D representation of the map. This resulted in the creation of several map alternatives of the same space using multiple frequencies (or dimensions). Eventually, we used this data in three axes (space, signal strength, signal frequency).
While time will be a key element for improving resolution on the space axis, it was incorporated to the space dimension itself. Our desired result is the best representation of the room map with the least noise, considering the noise factor as the incongruences and imprecisions in the resulting maps.
The experiments consisted of similar variables and attempts to find similarities and differences between the results obtained from the three sensors.
The static variables of the experiment were:
1. Scanning time: Which consisted of exactly 5 minutes (300 seconds) of smartphone movement in the room.
2. Smartphone movement route: The route that was used around the room was the same (or as similar as possible) between all the tests.
3. The room structure: The room was organized with potential objects and in the case of WiFi and XBee scanning, it incorporated the necessary access points (at least two). In all cases the room structure and objects positions did not vary.
The non-static variables in each experiment were:
1. Scanning frequency: In case of RIL it will change based on the necessities of the network provider. Phone communication RIL depends on network providers.
2. Sensor choice: For each experiment we changed the sensors we used to scan the frequency. The possible candidates were: RIL, WiFi, Xbee or WiFi + Xbee (simulating a FCMW RADAR).
The process started once the App script was executed from an SSH command over the local network. Then it followed a specific path in the room and moved through that path in 60 seconds per cycle (1 cycle per minute). In a period of 5 minutes the phone would follow the same path inside the room, passing close to the target objects.
This process was repeated three more times but with different sensor detection sources. Once the process was finished, the program stopped, and the information was then analyzed. Each of the data samples included the frequency information, the location (as precise as possible) as well as the time (in milliseconds format).
The resulting analysis was shown as a heat-based map trying to pinpoint the metallic object candidates in one part and the frequency energy source devices on the other, which was implemented based on other similar plotting system like in the StanXY app [20].
The room
The room in which the experiment took place is shown in Figure. 3.
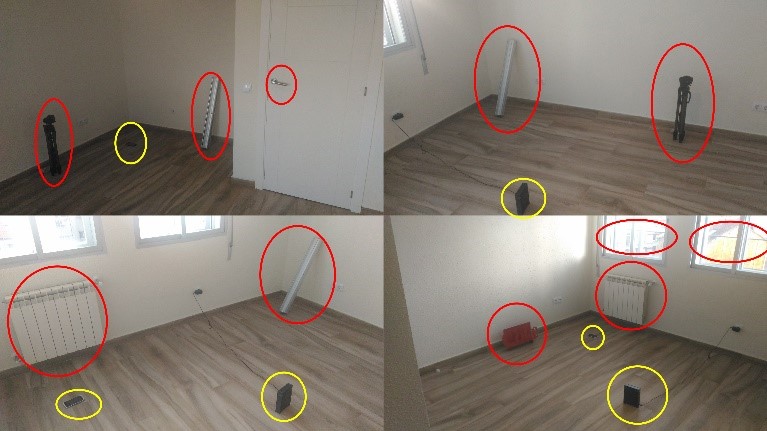
Figure 3. Experimental space room with potential interfering objects (RED) and TX/RX objects (YELLOW). The red circles represent the potential metallic objects, while the yellow circles represent frequency emitters.
For the first sensor (RIL), the potential emitters were the other smartphones in the room communicating with radio towers. We placed two different devices at an equidistant position. For the second sensor (WiFi), we placed one access point in a random position in the room as seen in Figure 4. For the third sensor, the XBee device was connected to the Nexus 5X as shown in Figures 5 and 6. They communicated with a ZigBee Philips router which acted as an AP for the device.
We did not deactivate the existing Wireless AP and combined them both to increase detection and resolution. For the final FCWM radar, we tried to define the emitter as the XBee device, and the receiver as the WiFi antenna in the device. We extracted data from the other RF emitters devices in the room and tried to use only the phone to generate the signal and receive the same signal.
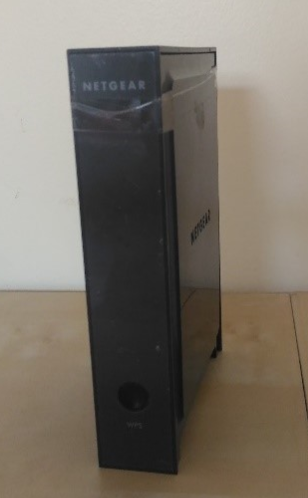
Figure 4. IEEE 802.11 TX/RX Access Point.
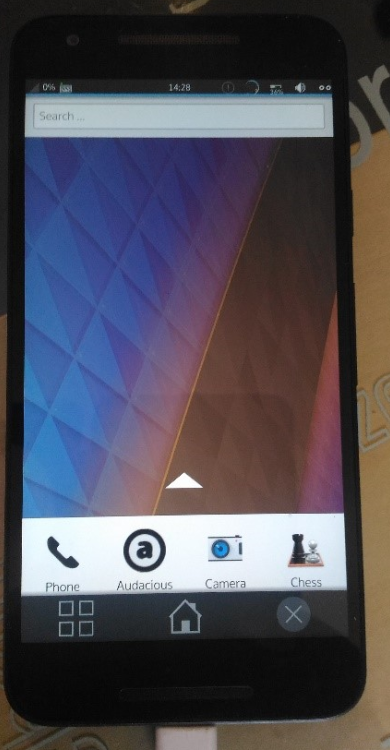
Figure 5. Nexus 5X running Plasma Mobile with background App.
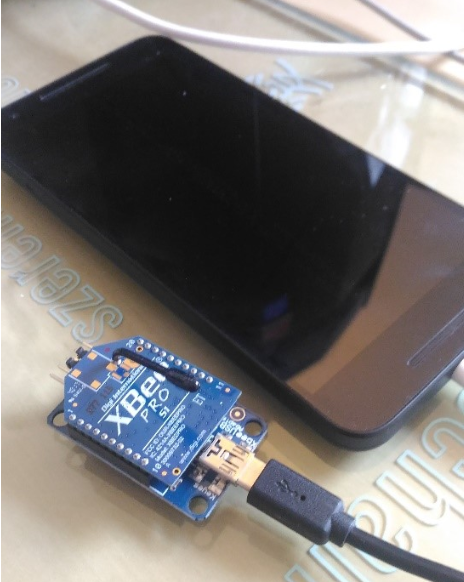
Figure 6. XBee Pro S1 chipset connected to adapter and Nexus 5X.
Remote access to big data
We incorporated a central database system to which each smartphone that interacted in our experiment would access and deposit the requested information.
The gathered data would then be interpreted in a centralized system to increase resolution information and seek the interesting hotspots in our objects’ map.
The information could only be sent from the device towards the database using lambda functions as can be seen in Figure 7.
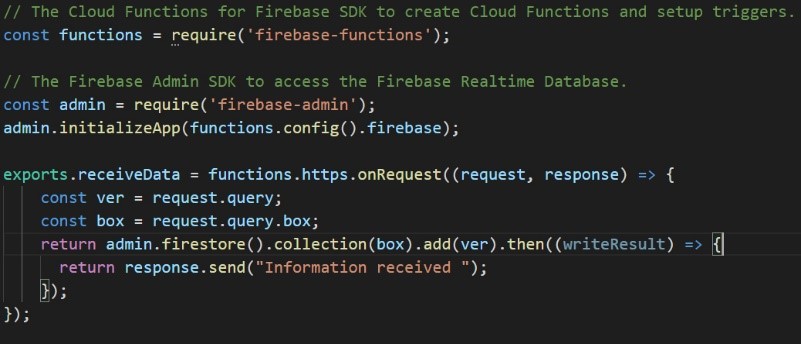
Figure 7. Firebase Lambda-Function for data reception from smartphone “box”
Firebase access
One of our main goals in this research was the ability to access the information remotely. To do so, we implemented a lambda-based system of functions, and later we defined the database and its representation, so we can visualize the information. This information can be seen in the following collection structure of the database of Figure 8. Each document in the collection represents a detection attempt by one smartphone, while a collection represents the smartphone or “box” sending the information.
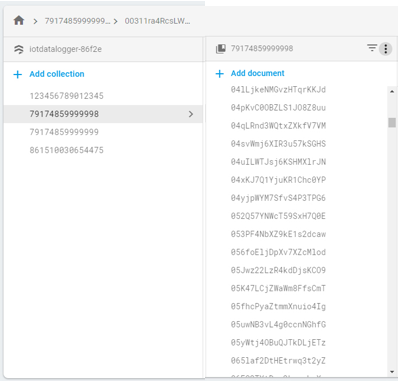
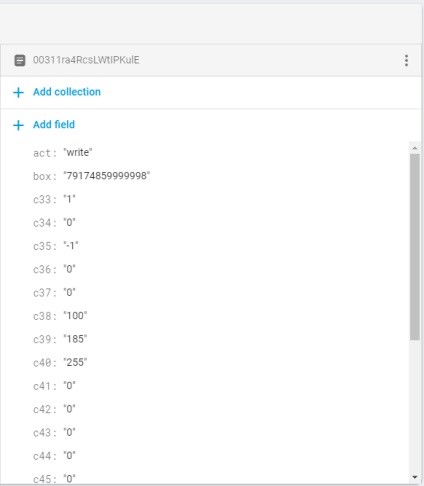
Figure 8. Top left: Smartphones “Box” sending information. Top right: The detection data log. Bottom: One document of a single detection with its sensor values and variables.
Sensor data
Three out of four sensors related experiments were successfully, as our attempt to create a reliable FCWM radar using XBee as an emitter and Wi-Fi antenna (on the device) as the receiver did not render any useful information.
On the other three sensing options we can confirm the reception of information, but each having a different level of reliability and resolutions. The overall results are summarized below.
Radio Interface Layer (GSM)
The first sensor we used in our script was the RIL sensor installed in the device. After mounting the device and opening a communication channel, we proceeded with the interpretation of the data, intensity and frequency of the signal.
Combining it with time and movement, we were able to obtain the following data graph (averages) shown in Figure 9.
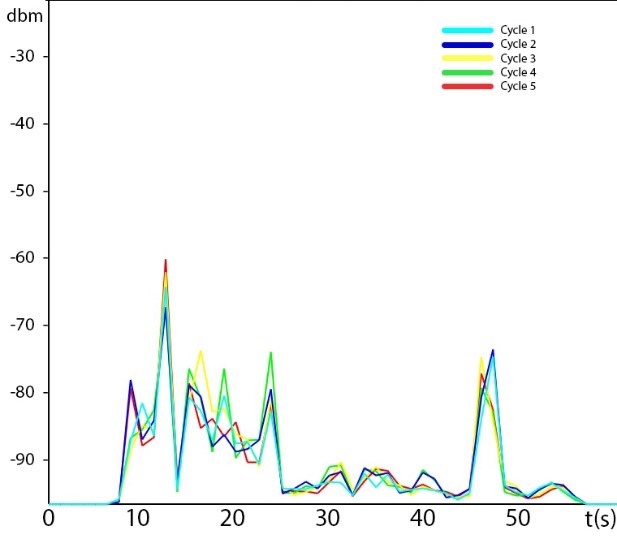
Figure 9. GSM Signal strength in dBm vs time in space movement for 60 seconds per cycle. 5 cycles in total are shown.
The resulting heat map that showed the approximate location of potential objects in the room, as well as the signal source from other smartphone devices is shown in Figure 10.
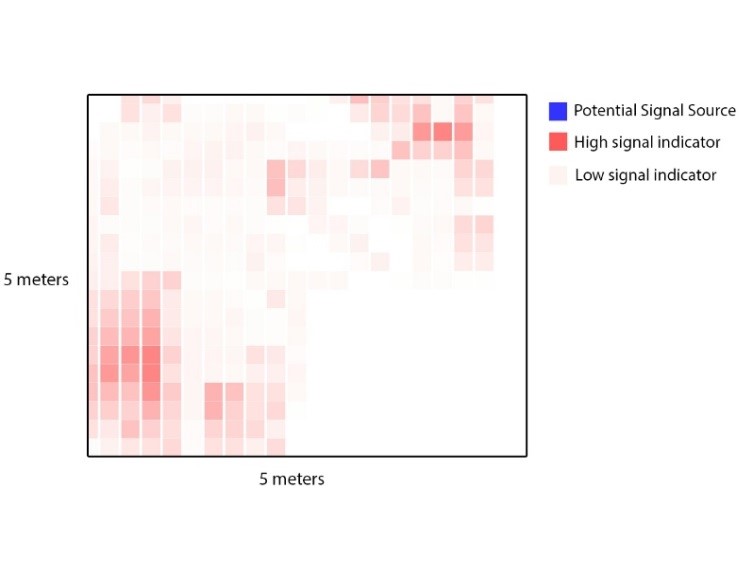
Figure 10. Resulting heat map of potential GSM signal strength spots in the room represented by square spots.
Wi-Fi
The second sensor used in our script was the Wi-Fi sensor installed in the device. After mounting the device and opening a communication channel, we proceeded with the interpretation of the data, intensity, and frequency of the signal.
Combining it with time and movement, the following data graph (averages) was obtained, as shown in Figure 11.
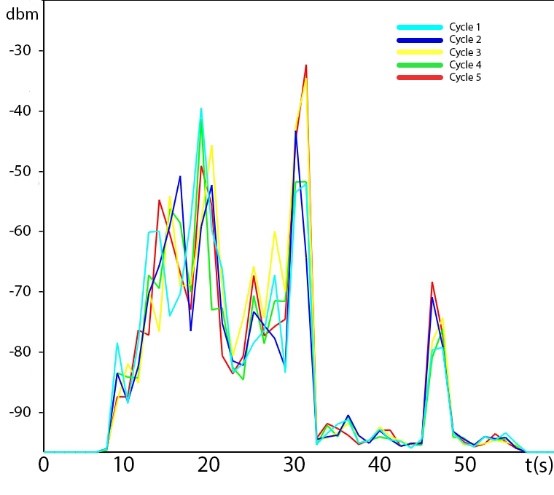
Figure 11. WiFi Signal strength in dBm vs time in space movement for 60 seconds per cycle, a total of 5 cycles is shown.
The resulting heat map that shows the approximate location of potential objects in the room, as well as the signal source from other AP devices is shown in Figure 12.
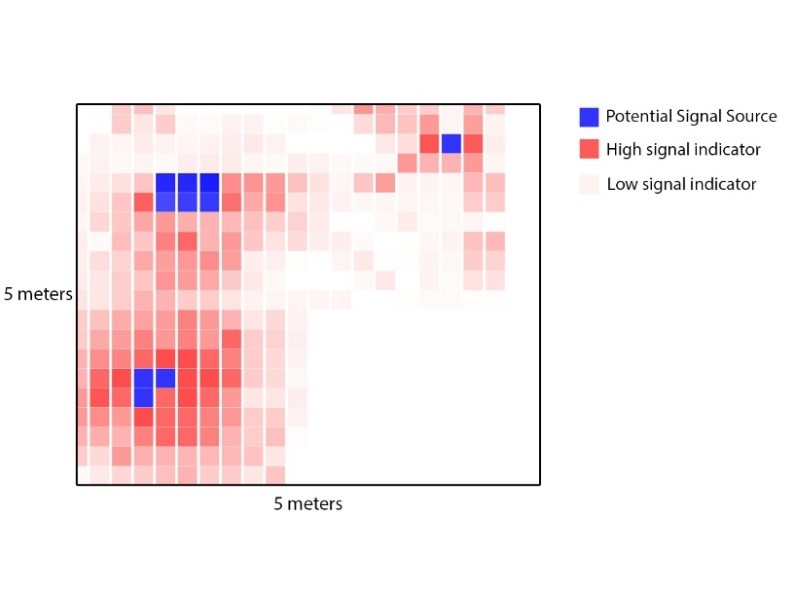
Figure 12. Resulting heat map of potential WiFi signal strength spots in the room represented by square spots.
XBee
The third sensor we used was the XBee sensor attached to the device through the USB port. After mounting the device and opening a communication channel to the port, we proceeded with the interpretation of the data, intensity, and frequency of the signal.
Combining it with time and movement, the following data table (averages) was obtained, shown in Figure 13.
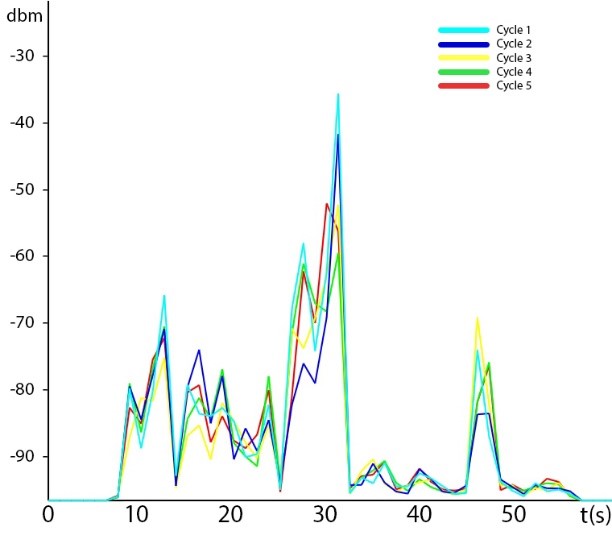
Figure. 13. XBee Signal strength in dBm vs time in space movement for 60 seconds per cycle, a total of 5 cycles are shown.
The resulting heat map that shows the approximate location of potential objects in the room as well as the signal source from ZigBee and WiFi AP devices is shown in Figure 14.
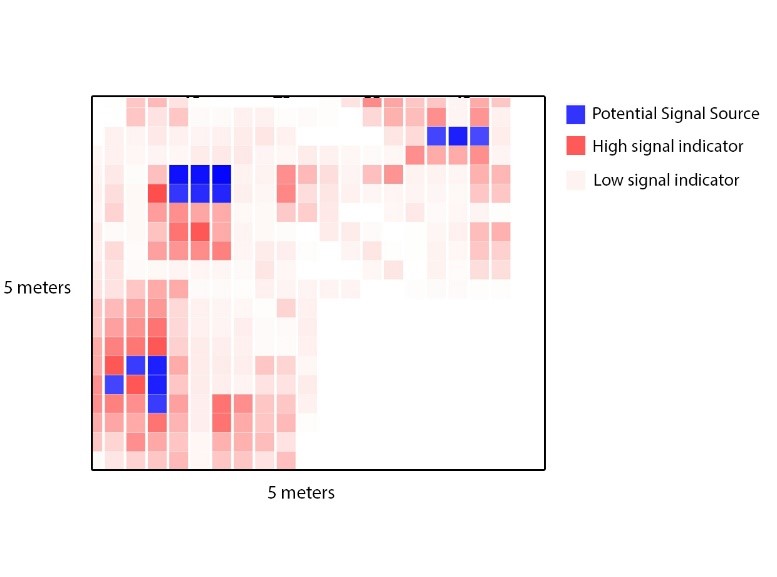
Figure 14. Resulting heat map of potential XBee signal strength spots in the room represented by square spots.
The experiment is subject to several limitations that must be addressed. First is the smartphone device. Our objective was to provide a global solution that could be applied to all devices, but eventually we had to limit it to a Nexus 5X smartphone. For future work, it would be interesting to adapt our solution to more smartphone devices.
Second was the environmental limitations. The experiment was conducted on a room that had one built up wall of thin material, and three original walls of the building (50-year-old building) made from bricks. One of these walls had two windows.
This is important to consider external frequencies could affect the overall result. Yet we noticed that because the sensor is located in the smartphone itself, and that the smartphone itself was the element moving around the room, the external frequencies would have to be considerably high to affect the result (noting that for GSM, external frequencies to filter the objects were utilized that may be a problem for IEEE 802.11 scanning or XBee scanning).
Regarding smaller metallic materials on the walls such as electric wires, they did not influence the overall results of the experiment. On the other hand, larger metallic objects did affect the detection process. In this experiment we had a big metal radiator as well as aluminum windows.
These objects were detected in the scanning process, and in case we want to detect certain types of metallic objects, a calibration may be needed to filter the unwanted data (unwanted potential objects).
Room size was a factor that limited our previous experiments and to a smaller extent it also affected our present experiment. In the previous experiment [1], the room size could affect the scanning area because we were counting on the fact that the room had to be 5 meters by 5meters to position the correct Rx device inside the room. On the other hand, this experiment is independent of room size, because the user of the scanning smartphone could walk around the room and start detecting potential metallic objects. The map would be drawn during that movement, and it will attempt to create a relative representation based on the user movement and position. In case the room size is large, GPS positioning can be included in the formula together with the gyroscope and accelerometer to improve the resolution of our resulting map.
The first likely practical applications for the work described are in the areas of security. Operations to neutralize threats inside closed rooms are always tricky, and the capacity to obtain the highest amount of information on the target location, for example the amount and position of weapons is crucial for a clean and fast neutralization.
It may even be possible to detect human mobility states by analyzing the movement frequency of metallic objects found on the people, which leads to another possible application, which is the detection of weapons carried from a distance. Calibrated correctly, it is possible to find metallic objects in open spaces when cross-referencing data from a variety of GSM radio frequency origins.
Finally another interesting application may be the capacity to create a remote scanning system on any place in the world, feeding a centralized computation device examplified in our case as a remote server to create a representation of maps based on metallic objects, allowing the detection of such objects in inaccessible locations.
From our findings, we conclude that it is possible to take advantage of several hardware capabilities of smartphone devices to turn them into a potential spectrum analyzing system, with the intention of extracting more sensible information to combine with intensity detection and gathering of big data.
Even though movement of the device was required, and that may reduce the effectiveness of the system, it was still able to achieve its desired aims.
Regarding the results themselves, both from the data and the maps pointing to the potential position of metallic objects, it is possible to see that in cases where the spectrum range is limited, and the change in frequency is constant, results had better resolution.
If we cross reference the original position of the objects represented in the following 20x20 grid of 22.5cm X 24.5cm (Fig. 15), representing each tile in the resulting heat map, we can measure the accuracy of our system when positioning the potential detected objects.
Following a simple ratio percentage equation, we obtained a percentage of the effective accuracy of our system. We will use the X-Y coordinates of the original map and the potential coordinates that we can extract from each measurement (each of the three methods). The results will be considered as resolution and will be as follows:
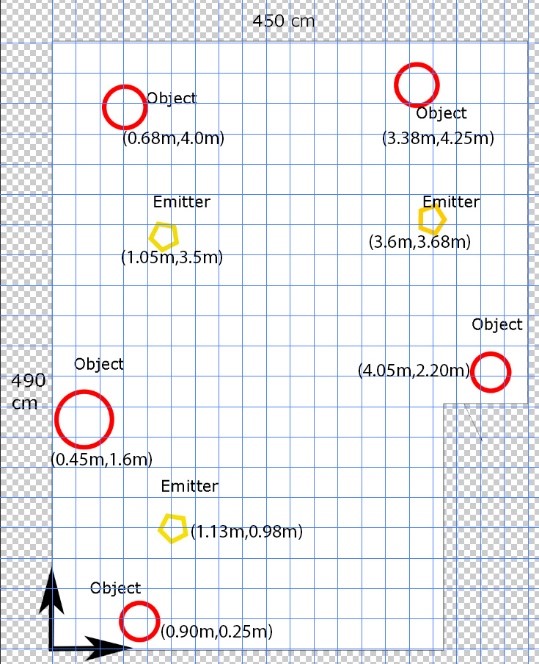
Figure 15. Original grid map representation of each object in its position.
Though precision was good considering the requirements, the resolution of RIL is lower than that of Wi-Fi and XBee. With a 47.833% accuracy, the RIL had the lowest score among between the proposed solutions. The WiFi sensor had a resolution up to 72% reliability, while the XBee sensor had increased resolution (possibly due to the addition of another frequency source) to 78.84% accuracy in resolution. The average of the three combined resulted in 66.23% accuracy.
The next step of our research was to create an FCWM radar combining the XBee emitter and WiFi receiver in the device, and even creating new devices that will communicate through the USB port to obtain an overall better mapping result.
The following table compares our previous experiment [1] and the one developed in this paper.
| Previous experiment | Present experiment |
|---|---|
| Multiple Arduino development for objects detection using FCWM technology. | One device to concentrate all computations and detection process. |
| Both internal and external devices to ensure object detection (An Tx inside the room, an Rx outside the room). | Both Tx and Rx will be located inside the room, working from the Smartphone device on the user. |
| Scanning paths are on X and Y axis, forcing the moving of an Rx device several times on the wall from outside the room. | Scanning paths are inside the room and move in an erratic line. The path will have to be repeated in the same manner several times. |
| Gathered data from the Arduino devices scanning the room will be sent to a Smartphone for data analysis and combinatory mapping resolution. | Gathered data will be processed directly in the moving Smartphone, resolved and sent to a remote server for external analysis. |
| Metallic objects detection | Metallic objects detection |
| The use of only one RF technology channel. | Comparison of several possible RF scanning tech (including XBee). |
| Required a higher deployment cost, and more specific scenarios. Yet it is a much safer scenario. | Required only to adapt the bugged Smartphone to be introduced in the room. It is a more risky scenario. |
| Higher adaptability to several existing scenarios, by allowing a more swarm-based connection system between the Arduino devices and thus increasing the resulting mapping resolution. | Low availability of candidate Smartphone devices to be bugged and execute the developed algorithm. |
Table. 1. Previous and present experiments key issues comparison.
The data that support the findings of this study are available from the corresponding author, J.B and Z.Z, upon reasonable request.
Jonathan Bar-Magen and Zeev Zalevsky conceived of the presented idea. Jonathan Bar-Magen developed the theory and performed the computations, he also carried out the experiment and gathered the results.
Jonathan Bar-Magen wrote the manuscript with the support of Zeev Zalevsky. Zeev Zalevsky supervised the project.
[1] Numhauser, J.B.M. and Zalevsky, Z., 2017. Frequency Modulated Continuous Wave RADAR for Objects Mapping in Enclosed Spaces Using Smartphones and Arduino Components. 3D Research, 8(2), p.17.
[2] Bar-Magen, J. (2013). Fog computing: introduction to a new cloud evolution. In Escrituras silenciadas: paisaje como historiografía (pp. 111-126). Servicio de Publicaciones.
[3] Rayanchu, S., Patro, A. and Banerjee, S., 2011, November. Airshark: detecting non-WiFi RF devices using commodity WiFi hardware. In Proceedings of the 2011 ACM SIGCOMM conference on Internet measurement conference (pp. 137-154). ACM.
[4] Zhang, T., Patro, A., Leng, N. and Banerjee, S., 2015, February. A wireless spectrum analyzer in your pocket. In Proceedings of the 16th International Workshop on Mobile Computing Systems and Applications (pp. 69-74). ACM.
[5] Yang, P., Yan, Y., Li, X.Y., Zhang, Y., Tao, Y. and You, L., 2016. Taming cross-technology interference for Wi-Fi and ZigBee coexistence networks. IEEE Transactions on Mobile Computing, 15(4), pp.1009-1021.
[6] Phillips, C., Ton, M., Sicker, D. and Grunwald, D., 2012, October. Practical radio environment mapping with geostatistics. In Dynamic Spectrum Access Networks (DYSPAN), 2012 IEEE International Symposium on (pp. 422-433). IEEE.
[7] Yubo, Y., Panlong, Y., Xiangyang, L., Yue, T., Lan, Z. and Lizhao, Y., 2013, September. Zimo: Building cross-technology mimo to harmonize zigbee smog with wifi flash without intervention. In Proceedings of the 19th annual international conference on Mobile computing & networking (pp. 465-476). ACM.
[8] Shi, L., Bahl, P. and Katabi, D., 2015, May. Beyond Sensing: Multi-GHz Realtime Spectrum Analytics. In NSDI (pp. 159-172).
[9] Park, H., Noh, J. and Cho, S., 2016. Three-dimensional positioning system using Bluetooth low-energy beacons. International Journal of Distributed Sensor Networks, 12(10), p.1550147716671720.
[10] Zacharias, S., Newe, T., O’Keeffe, S. and Lewis, E., 2012, June. Identifying sources of interference in RSSI traces of a single IEEE 802.15. 4 channel. In The 8th International Conference on Wireless and Mobile Communications (pp. 408-414).
[11] Höyhtyä, M., Mämmelä, A., Eskola, M., Matinmikko, M., Kalliovaara, J., Ojaniemi, J., Suutala, J., Ekman, R., Bacchus, R. and Roberson, D., 2016. Spectrum occupancy measurements: A survey and use of interference maps. IEEE Communications Surveys & Tutorials, 18(4), pp.2386-2414.
[12] Hithnawi, A., Shafagh, H. and Duquennoy, S., 2015, April. TIIM: technology-independent interference mitigation for low-power wireless networks. In Proceedings of the 14th International Conference on Information Processing in Sensor Networks (pp. 1-12). ACM.
[13] Hermans, F., Larzon, L.Å., Rensfelt, O. and Gunningberg, P., 2012. A lightweight approach to online detection and classification of interference in 802.15. 4-based sensor networks. ACM SIGBED Review, 9(3), pp.11-20.
[14] Almunawar, M.N., Anshari, M. and Susanto, H., 2018. Adopting Open Source Software in Smartphone Manufacturers' Open Innovation Strategy. In Encyclopedia of Information Science and Technology, Fourth Edition (pp. 7369-7381). IGI Global.
[15] Galarza, E.E., Egas, F.D., Silva, F.M., Velasco, P.M. and Galarza, E.D., 2018, January. Real Time Driver Drowsiness Detection Based on Driver’s Face Image Behavior Using a System of Human Computer Interaction Implemented in a Smartphone. In International Conference on Information Theoretic Security (pp. 563-572). Springer, Cham.
[16] Baliarda, C.P., Mumbru, J. and Ilario, J., Fractus SA, 2018. Multiple-body-configuration multimedia and smartphone multifunction wireless devices. U.S. Patent 9,899,727.
[17] Baik, K., Kim, S., Woo, S. and Choi, J., 2010, July. Boosting up Embedded Linux device: experience on Linux-based Smartphone. In proceedings of the Linux Symposium (pp. 9-18).
[18] Morshed, M.N., Khatun, S., Vijayasarveswari, V., Fakir, M.M., Ibrahim, M.Z., Hawari, K. and Ariff, M.H., 2018. Cognitive Radio Based Optimal Channel Sensing for Resource Allocation in Communications. Journal of Telecommunication, Electronic and Computer Engineering (JTEC), 10(1-3), pp.115-119.
[19] Gabay, Isahar, Meir Danino, and Zeev Zalevsky. "Radio frequency Echo mapping with cellular devices." Scientific Phone Apps and Mobile Devices 4, no. 1 (2018): 1.
[20] Budianto, Ian-Hartono, Chun-Foong Wong, Phi-Vu Nguyen, and Samuel Ken-En Gan. "StanXY: standard curve app for Android." Scientific Phone Apps and Mobile Devices 1, no. 1 (2015): 2.
©2019 Bar-Magen and Zalevsky. Open Access. This article is distributed under the terms of the Creative Commons Attribution 4.0 International License (http://creativecommons.org/licenses/by/4.0/), which permits unrestricted use, distribution, and reproduction in any medium, provided you give appropriate credit to the original author(s) and the source, provide a link to the Creative Commons license, and indicate if changes were made.
APD SKEG Pte Ltd is the member of

Scientific Phone Apps and Mobile Devices is in the Research collection of